

In the competitive world of real estate, staying ahead requires more than intuition—it demands
data-driven insights. Rising costs, shifting market demands, and operational inefficiencies can quickly drain profits. That’s where Power BI dashboards step in, transforming raw data into actionable
intelligence.
In this blog, we’ll walk you through a real estate dashboard built in Power BI. With a focus on property management, sales performance, leases, and asset performance, this dashboard is a one- stop solution for smarter decision-making. Let’s dive into its features and benefits.
1. Overview: A Snapshot of Your Real Estate Portfolio
The Overview is your control centre, offering a bird’s-eye view of your entire portfolio. It simplifies complex metrics into actionable visuals.

Here’s what it includes:
⇒ Total Properties: Get a quick count of all properties in your portfolio.
⇒ Total Revenue Comparison: A line chart tracks revenue trends across months, quarters, and years.
⇒ Rent vs Sale: See which revenue stream dominates—rental income or sales revenue.
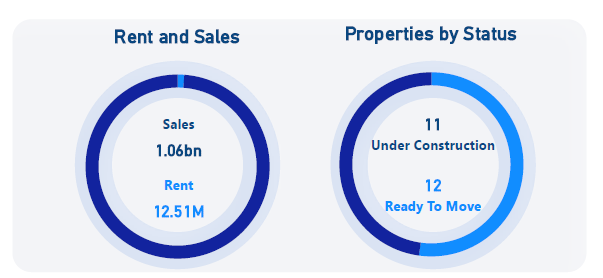
⇒ Property Status: Visualize properties by their current status—under construction or ready to move.
⇒ Revenue by Property Type: Identify the top-performing categories like residential or commercial properties.
The Overview page allows builders to spot trends, compare performance, and prioritize areas needing attention.
2. Sales Insights: Turning Trends into Revenue
The Sales dives deep into your revenue streams and sales performance. It highlights key trends and uncovers growth opportunities.
What you’ll find here:

⇒ Revenue Trends: A line chart showing total sales revenue over time.
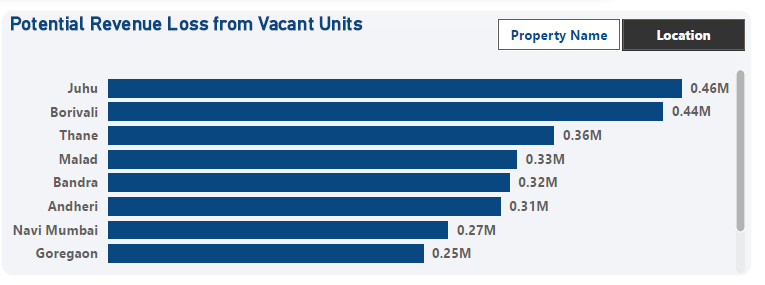
⇒ Potential Revenue Loss: Identify losses caused by vacant units with clear visuals.
⇒ Sales Revenue Table: A detailed table compares Month-To-Date (MTD), Quarter-To-Date (QTD), and Year-To-Date (YTD) revenue.

Builders and developers can spot underperforming properties, optimize vacant units, and plan for higher conversions.
3. Property Page: Zooming In on Individual Assets
The Property provides granular insights into each property, giving you a full understanding of performance at the ground level.
Here’s what it includes:
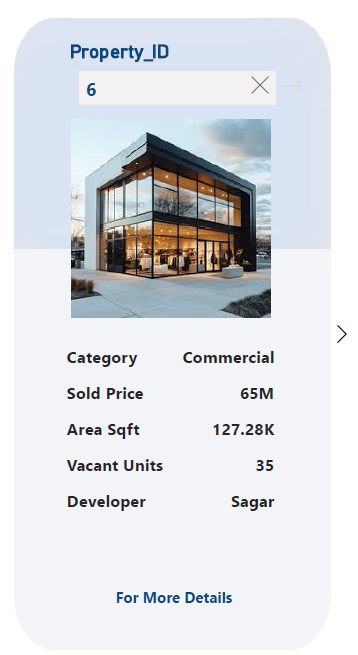
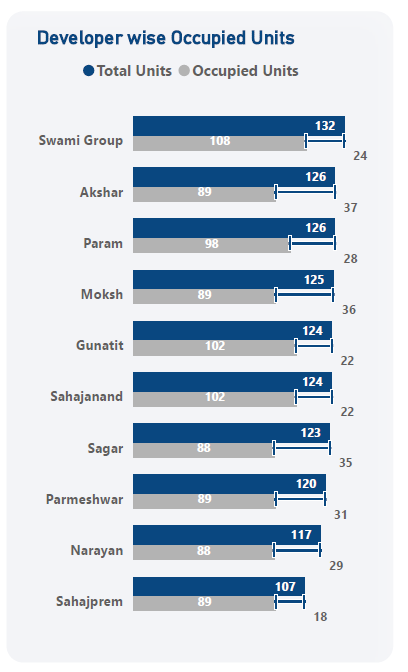
⇒ Property-Wise Details: View property images, descriptions, and financial metrics. Developer-Wise Occupancy: A bar chart compares vacant, occupied, and total units across developers.

⇒ Revenue vs Expenses: Side-by-side charts for revenue and expenses highlight profitability for each property.
Builders gain the ability to drill down into individual properties, monitor financial health, and identify improvement areas.
4. Lease Management: Optimizing Rental Income
Leases are the backbone of steady revenue in real estate. The Lease simplifies lease tracking and optimization.
Here’s what it includes:

⇒Total Leases: Categorized into short-term, long-term, and expired leases.
⇒ Total Rent Revenue: Monitor total rental income across all properties.
⇒ Rent by Property: Visualize rent revenue contributions from individual properties.
⇒ Expiring Leases: Highlight aging leases to ensure timely renewals.
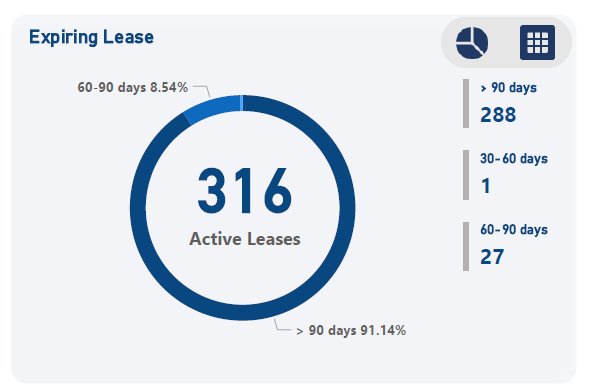
Proactive lease management helps avoid revenue gaps and ensures smooth tenant transitions.
5. Asset Performance: Measuring ROI and Growth
The Assets focuses on portfolio-level performance metrics, helping you assess returns and efficiency. Here’s what it includes:
⇒ Revenue Per Quarter: A line chart tracks quarterly revenue trends.
⇒ Average ROI and Rental Yield: Measure profitability across properties.
⇒ Vacancy Rate Analysis: Visualize underutilized properties with vacancy rate metrics.
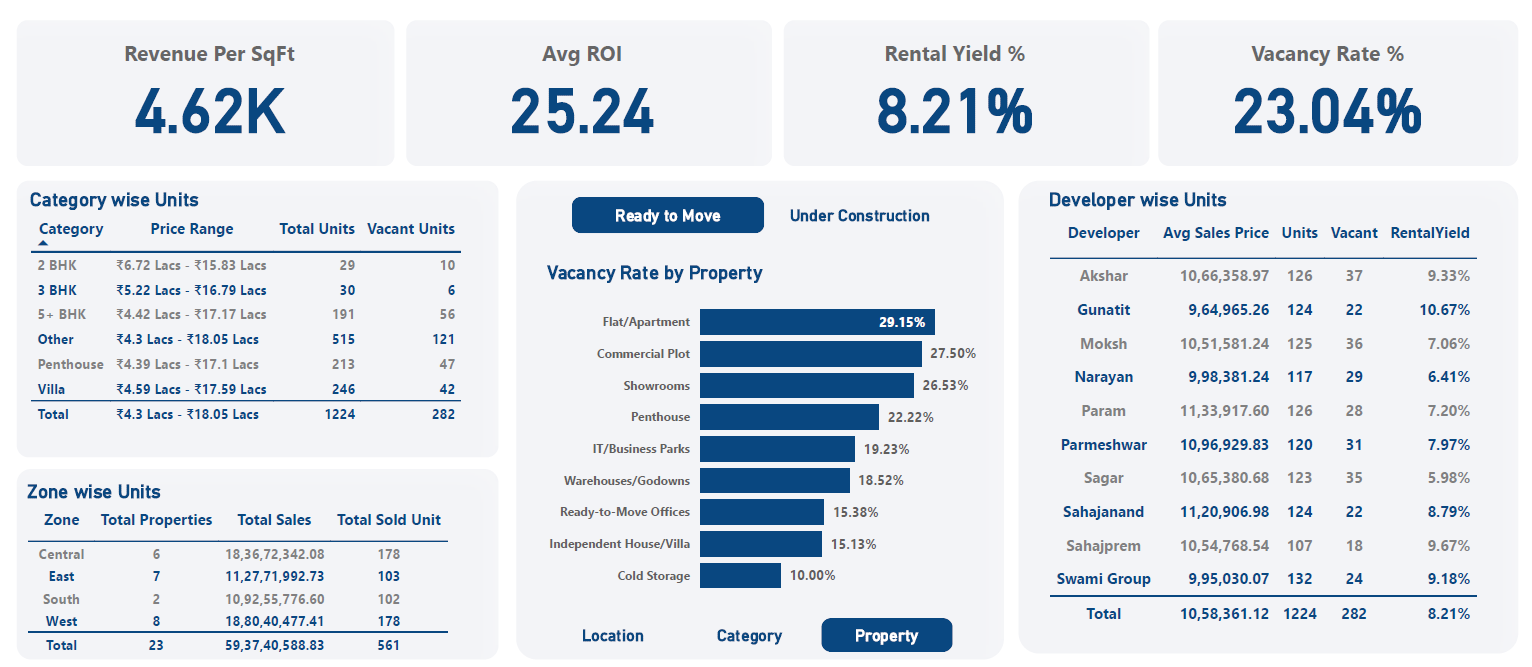
Builders can make smarter investment decisions by identifying the most profitable assets and optimizing underperforming ones.
Why Power BI is Essential for Real Estate Success
Power BI transforms real estate operations by offering:
⇒ Real-Time Insights: Say goodbye to outdated reports and hello to instant decision-making.
⇒ Actionable Analytics: From rent vs sale to expiring leases, every metric drives smarter strategies.
⇒ Enhanced Profitability: Builders can focus on high-performing properties, minimize losses, and optimize budgets.
With an intuitive interface and interactive visuals, this dashboard empowers builders to stay ahead in a competitive market.


